Category Archives: Real Estate Market Reports

  • -

Champaign County IL Real Estate Market Report, October 2011

Category:Real Estate Market Reports

October 2011 Residential Sales Information Compared to October 2010

The following real estate market information concerns only residential sales in greater Champaign County, IL and includes houses, condos, co-ops, and zerolots

October 2011 Closed Sales Statistics:

156 units sold
$148,184 average sale price
93.3% sale-to-list price ratio
102 average days on the market

October 2010 Closed Sales Statistics:

165 units sold
$133,365 average sale price
94.5% sale-to-list price ratio
100 average days on the market

Champaign IL Real Estate Market Report

What’s going on in our Champaign, IL real estate market?

As a whole, the real estate activity in Champaign County IL for October 2011 was fairly comparable to October 2010. Total number of sales and days on the market were quite similar, though our average sale price was up compared to last October. For the year, our average sale price is still down a bit compared to last year, while total number of sales is up just a tad.

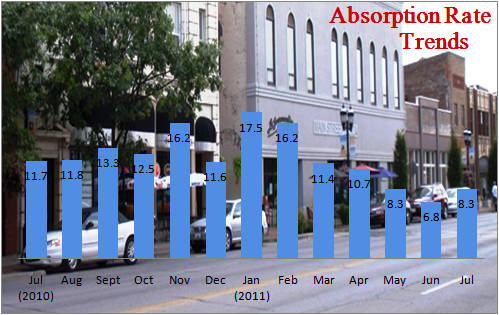
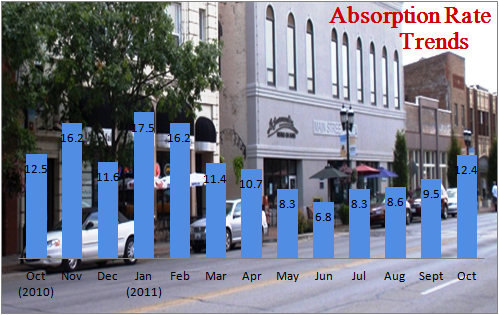
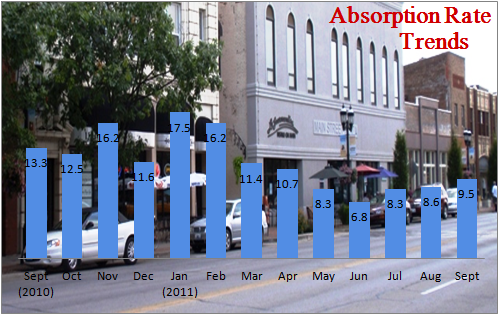
The absorption rate, as you can see below, is heading upwards for the winter as usual, but the good news is that we ended October with about 5% fewer homes on the market than we had at this time last year, and this trend is continuing into November.

Champaign IL Real Estate Market Report

What is an Absorption Rate?

*Information is deemed reliable, but not guaranteed to be accurate. Statistics in this report were obtained through the Champaign County Association of Realtors®

  • -

3rd Quarter 2011 Housing Report- Champaign IL

Category:Real Estate Market Reports

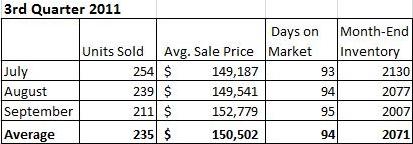
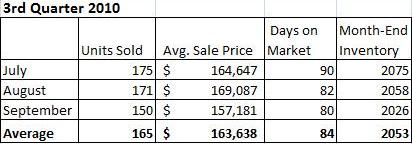
Here in Champaign County the real estate market is indisputably seasonal, and with the 3rd quarter of 2011 behind us, sales activity will ease into the holidays and eventually pick back up after the 1st of a brand-new year. It’s a perfect time for evaluating the year to-date, so let’s take a look at how our local market is doing…

There’s no doubt we’re still facing many of the same challenges that we’ve been up against for a few years now. Our inventory of homes on the market has been hovering around 2,000 since the beginning of 2010 and for 2011 thus far we’ve averaged 2,029 homes on the market. With this much competition, sellers are forced to engage their homes in both a beauty contest and a price war. Meanwhile buyers have an abundance of homes to choose from and, for now, are still enjoying record-low interest rates.

While we ended 2010 with an average sale price of $148,082 the average sale price for the first three quarters of 2011 stands at $139,393, approximately a 6% decrease. What’s fascinating, and certainly partially to blame for the decline in average price, is that the total number of sales in the price range of $1 to $50,000 is on track to be TWICE as many in 2011 as in 2010! In other words, we’re seeing more foreclosures this year than we have in years past, and that my friends will bring prices down.

On the other hand, we’re currently on track to end the year with more residential sales total than last year, a promising outlook. Right now our absorption rate is at 9 months compared to 13 months this same time last year, and over the past three months we’ve seen a slight but nonetheless upward price trend. While anything could happen over the next quarter to finish out the year, these small victories are worth acknowledging.

Champaign IL Real Estate Market Report

Champaign IL Real Estate Market Report

*Information is deemed reliable but not guaranteed to be accurate. After all, I’m only human 😉


  • -

Champaign County IL Real Estate Market Report, September 2011

Category:Real Estate Market Reports

September 2011 Residential Sales Information Compared to September 2010

The following real estate market information concerns only residential sales in greater Champaign County, IL and includes houses, condos, co-ops, and zerolots.

September 2011 Closed Sales Statistics:

  • 211 units sold
  • $152,779 average sale price
  • 95.5% sale-to-list price ratio
  • 95 average days on the market

September 2010 Closed Sales Statistics:

  • 150 units sold
  • $157,181 average sale price
  • 95.8% sale-to-list price ratio
  • 80 average days on the market

Champaign IL Real Estate Market

What’s going on in our Champaign IL real estate market?

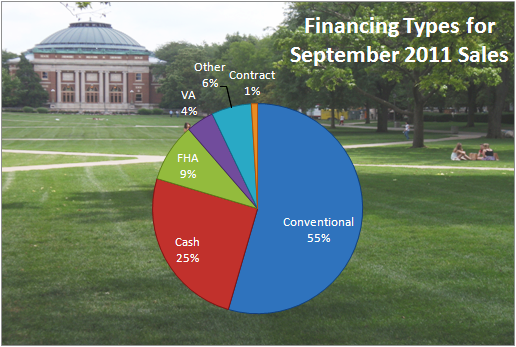
In terms of number of sales, this past month was the strongest September we’ve seen since 2007 with 211 total sales. The average sale price also continued an upward trend from the previous month and was the highest average sale price we’ve had for any month so far this year. While we’re still on track to have an overall decline in average sale price for 2011 compared to 2010, the level of activity for this quarter is a solid improvement over the first half of the year. Look for our 3rd quarter market report here on our website soon!

Champaign IL Real Estate Market

What is an Absorption Rate?

*Information is deemed reliable, but not guaranteed to be accurate. Statistics in this report were obtained through the Champaign County Association of Realtors®

  • -

Champaign County IL Real Estate Market Report, August 2011

Category:Real Estate Market Reports

August 2011 Residential Sales Information Compared to August 2010

The following real estate market information concerns only residential sales in greater Champaign County, IL and includes houses, condos, co-ops, and zerolots

August 2011 Closed Sales Statistics:

* 239 units sold
* $149,457 average sale price
* 95.0% sale-to-list price ratio
* 94 average days on the market

August 2010 Closed Sales Statistics:

* 171 units sold
* $169,087 average sale price
* 95.1% sale-to-list price ratio
* 82 average days on the market

Champaign IL Real Estate Market Report

What’s going on in our Champaign IL real estate market?

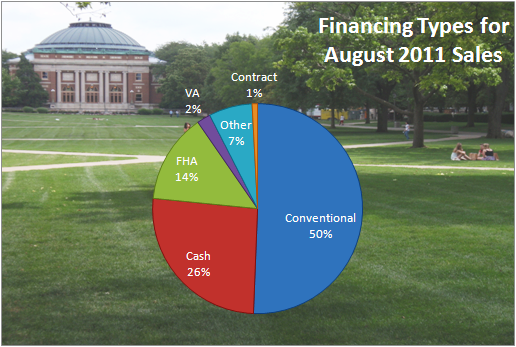
As expected, we had significantly more sales in August 2011 than in August 2010, not because the economy is seeing an upswing (wishful thinking!) but because of the lack of a tax credit this year compared to last year. And while things could still change in the next few months, we’re currently on track to see an improvement in total sales overall for 2011 compared to 2010.

It seems the struggle this year has been the marked decrease in average sales price. While the overall decrease in average sales price from 2007 to 2010 was only about 3%, we’ll likely see an even larger drop from 2010 to 2011. What this means for sellers is, you need to price your home right, usually just under market value. When the price trend is heading down, pricing your home AT market value often isn’t good enough.

Any buyers who have been on the fence, now would be a good time to hop off it 🙂 Interest rates are once again at an all-time low and some real estate markets in the country are beginning to see an upward trend again. Eventually, we will, too. I believe it’s just a matter of time…

Champaign IL Real Estate Absorption Rate Trends

What is an Absorption Rate?

*Information is deemed reliable, but not guaranteed to be accurate. Statistics in this report were obtained through the Champaign County Association of Realtors®

  • 0

Champaign County IL Real Estate Market Report, July 2011

Category:Real Estate Market Reports

July 2011 Residential Sales Information Compared to July 2010

The following real estate market information concerns only residential sales in greater Champaign County, IL and includes houses, condos, co-ops, and zerolots

July 2011 Closed Sales Statistics:

* 254 units sold
* $149,187 average sale price
* 96.4% sale-to-list price ratio
* 90 average days on the market

July 2010 Closed Sales Statistics:

* 175 units sold
* $164,647 average sale price
* 96.1% sale-to-list price ratio
* 75 average days on the market

Champaign IL Real Estate Market Report

What’s going on in our Champaign IL real estate market?

This July there were 254 units sold compared to 175 units sold in July 2010. As I explained last month, it was very likely that we would have a strong month compared to a year ago because of last year’s tax credit. The tax credit expired in June 2010 resulting in a very strong June and a very weak July and August. This year, there’s no tax credit. Therefore, we had no drop-off in sales. I expect that sales for August will be stronger than last year, as well.

The average sale price bounced back up finally, though it’s certainly not where it was a year ago. We had both fewer sales in the lowest price ranges this month and an increase in sales in the upper ranges. At the end of July, we were left with an inventory of 2,100 homes on the market and an absorption rate of 8.3 months. I expect we’ll see inventory at this level for some time to come, probably a number of years. Consider it normal 🙂

Champaign IL Real Estate Market Statistics

What is an Absorption Rate?

*Information is deemed reliable, but not guaranteed to be accurate. Statistics in this report were obtained through the Champaign County Association of Realtors®

  • 0

Champaign IL Housing Market Report 2nd Quarter 2011

Category:Real Estate Market Reports

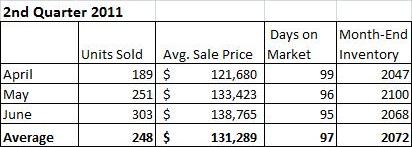
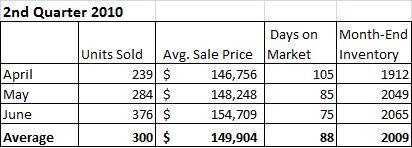
Below you’ll find two charts comparing residential sales statistics for the 2nd quarter of this year to the 2nd quarter of last year. Like I mentioned in my recent June report, the average sale price has dropped dramatically this quarter compared to this time last year, and this is largely due to an abnormal increase in low-priced sales. Let me quote the explanation I gave in my June report:

“From January to December of 2010 we had a total of 207 residential sales in the price range of $1 – $49,999. From January to June 30th of 2011, we have already had 208 sales in that same price range, meaning we’re on track to have TWICE as many sales in the lowest price range as last year. (Last year 9% of the total sales were in this price range, and so far this year 18% of the total sales are in this price range.) That, my friends, will certainly bring prices down for the year.”

In that same report, I also briefly discussed the drop in total number of sales and why this doesn’t concern me, at least not at this time. June 2010 was the deadline to close on a home to receive the first-time homebuyer tax credit. While the number of sales was up for June last year, that number dropped off for July and August, which are typically two very strong months. This year, we don’t have a tax credit inflating numbers. That means that while the number of sales is down for this quarter compared to last year, we will in all likelihood have a much stronger 3rd quarter than last year and hopefully it will be enough to even out or even surpass last year’s numbers.

As you can see, the inventory of homes on the market in Champaign County has stayed greater than 2,000 all quarter, and this fact has made it tough for homeowners trying to sell. There’s simply a ton of competition out there, so pricing your home right and having it in the very best showing condition are vitally important. On the other hand, the numbers provide plenty of evidence that homes are selling and buyers are buying. It’s a tough market, but not an impossible one to work with 🙂

Champaign IL Housing Market Report

Champaign IL Housing Market Report

*Information is deemed reliable but not guaranteed to be accurate.


  • 0

Champaign County IL Real Estate Market Report, June 2011

Category:Real Estate Market Reports

June 2011 Residential Sales Information Compared to June 2010

The following real estate market information concerns only residential sales in greater Champaign County, IL and includes houses, condos, co-ops, and zerolots.

June 2011 Closed Sales Statistics:

* 303 units sold
* $138,765 average sale price
* 96.0% sale-to-list price ratio
* 95 average days on the market

June 2010 Closed Sales Statistics:

* 376 units sold
* $154,709 average sale price
* 96.1% sale-to-list price ratio
* 75 average days on the market

Champaign IL Housing Market Report

What’s going on in our Champaign IL real estate market?

Once again, there’s good news and there’s bad news this month; let’s get the bad news out of the way first, shall we? 🙂

The average sale price for closings this month is way down from where it was a year ago, and I’m going to argue that foreclosures mostly concentrated in already low-priced neighborhoods are partially, if not primarily, to blame. From January to December of 2010 we had a total of 207 residential sales in the price range of $1 – $49,999. From January to June 30th of 2011, we have already had 208 sales in that same price range, meaning we’re on track to have TWICE as many sales in the lowest price range as last year. (Last year 9% of the total sales were in this price range, and so far this year 18% of the total sales are in this price range.) That, my friends, will certainly bring prices down for the year.

Now for the good news: we had 303 units sell in June 2011 compared to 376 units sold in June 2010. It may not seem like good news, but just hear me out…

Last June was the deadline for closing on a home to receive the first-time homebuyer tax credit, and then sales dropped from 376 units in June to 175 total in July, a historically low number. This year we don’t have a tax credit; therefore, while our sales for June weren’t as strong as last year, in all likelihood we are going to see a very strong July compared to last year. The end result is that total units sold this year very well might surpass total units sold last year. I’ll talk about this more in my quarterly market report to follow soon!

Champaign IL Absorption Rates Housing Market

What is an Absorption Rate?

*Information is deemed reliable, but not guaranteed to be accurate. Statistics in this report were obtained through the Champaign County Association of Realtors®

  • 0

Champaign County IL Real Estate Market Report, May 2011

Category:Real Estate Market Reports

May 2011 Residential Sales Information Compared to May 2010

The following real estate market information concerns only residential sales in greater Champaign County, IL and includes houses, condos, co-ops, and zerolots.

May 2011 Closed Sales Statistics:

* 251 units sold
* $133,423 average sale price
* 95.6% sale-to-list price ratio
* 96 average days on the market

May 2010 Closed Sales Statistics:

* 284 units sold
* $148,248 average sale price
* 96.8% sale-to-list price ratio
* 85 average days on the market

Champaign IL Real Estate Market Report

What’s going on in our Champaign IL real estate market?

Things appear to finally be picking up a little this year, though as you can see, the numbers aren’t all that comparable to last year. I’m hopeful that we’ll see some stronger numbers for the coming 2-3 months to help offset a slow start this year. I hate to sound like a broken record, but I think it’s important to mention once again that our numbers this year will look completely different from last year, at least on a month-by-month comparison, and this is because of the tax credit last year which inflated the sales through June.

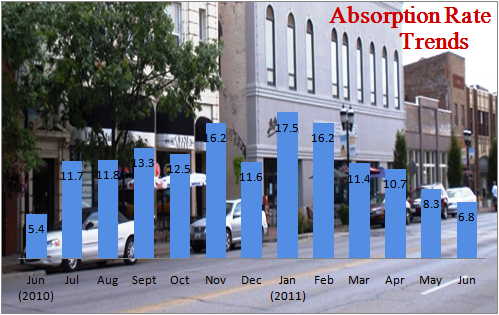
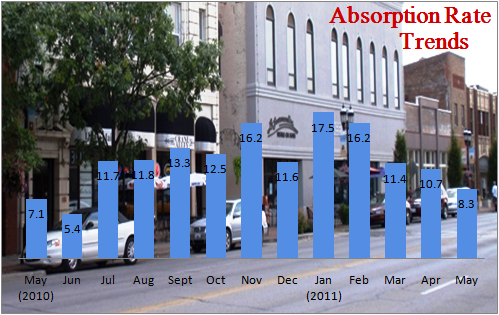
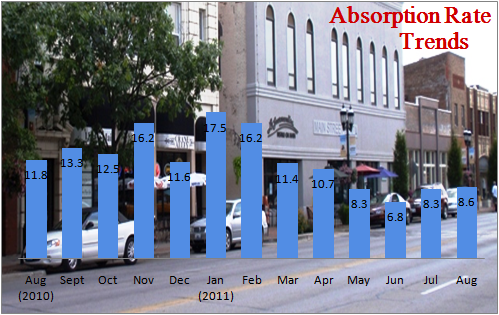
Compared to last month, the number of sales in Champaign County increased significantly and the average sale price rose, too. Also worth noting is that our absorption rate has dropped to 8.3 months (see chart below). Between 5 and 6 months is considered a stable market; my hope is that we’ll get to see an absorption rate in that range before the end of the summer. Keep your fingers crossed 🙂

Champaign IL Real Estate Market Report

What is an Absorption Rate?

*Information is deemed reliable, but not guaranteed to be accurate. Statistics in this report were obtained through the Champaign County Association of Realtors®

Featured Listings


Wooded Lots For Sale

We have three lovely rural lots available and ideal for building... large mature trees, creeks, wildlife and an abundance of quiet. These lots are enchanting and just 35 minutes from Urbana and 20 minutes from Danville. Realtor owned. Call Debbie at 217.369.9897 for details.

Debbie Hensleigh on how we do real estate at Beringer Realty.